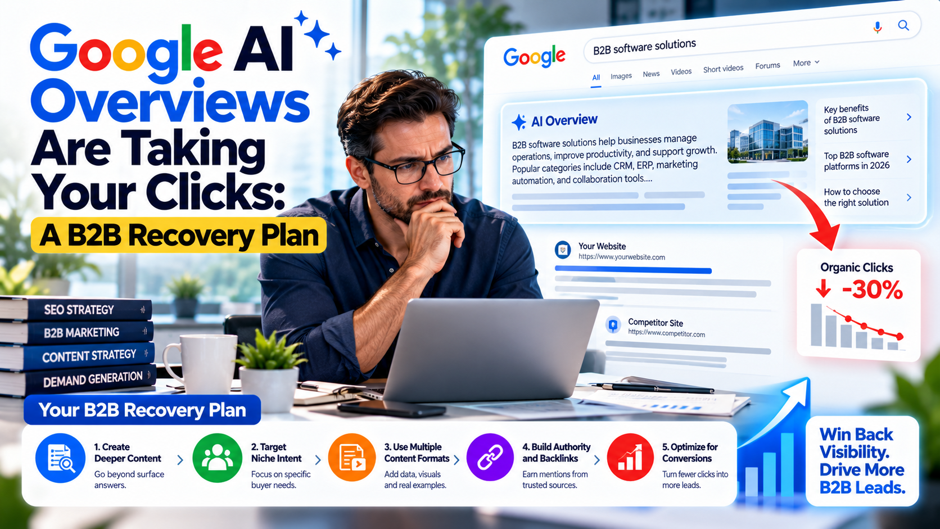
Google AI Overviews Are Taking Your Clicks: A B2B Recovery Plan
Consider an illustrative head of marketing at a software company that sells workflow tools to finance teams. In March her team’s rankings looked healthy and impressions in Search Console were flat, yet organic visits fell by a quarter by September. Demo requests dipped less than visits did, which confused everyone in the Monday meeting. Someone blamed the algorithm, someone blamed seasonality and someone pasted a headline saying Google’s generated answers had cut clicks by more than half. She needs to know how much of her drop is real, what can be recovered and what to do first.
This article explains what studies report about generated answers and clicks, why their numbers disagree, how to diagnose your own drop and a recovery plan for business-to-business sites. It draws on a summary of an Ahrefs study, a secondary roundup of 12 studies, a Growfusely post, a Priority Pixels note on Search Console reporting and Google’s own documentation. Most of those sources sell something or summarize others, so each figure is attributed and flagged. The impact model near the end uses invented numbers. Confirm any legal or contract point with counsel.
TL;DR
- The reported click losses are real but vary widely, and the sources disagree. A February 2026 report on an Ahrefs study says top-ranked results lost 58% of their click-through rate when an overview appeared, while a roundup cites an average drop of 15.49% from another study. Different samples, metrics and dates explain much of the gap. Measure your own pages before you act on any headline number.
- Informational pages lose first, and evaluation pages hold up better. A Growfusely post says definitional queries get absorbed early while comparison and alternatives queries keep more of their clicks. That’s a vendor’s claim without a stated sample. In the invented model here, clicks fall 28% but demos fall only 16%, because pages that compare options carry most of the demos.
- Google says no special treatment is needed to appear in generated answers. Its documentation says eligible pages are indexed and snippet-eligible. Protect evaluation pages, publish original data worth citing, keep your brand description consistent and track citations next to sessions. Report results to leadership with the caveat that Search Console doesn’t yet show clicks from AI surfaces separately.
What changed in search results
Google now shows generated summaries at the top of many results, with links to supporting pages. For some queries, the summary answers the question well enough that the searcher stops. For others, the searcher clicks a cited source or scrolls to the regular listings. The effect on any site depends on which queries it ranks for, whether its pages are cited and what the searcher wanted. Sites built on definitions and how-to explainers feel the change first, because those queries are the easiest to answer in a paragraph.
Business sites have a particular exposure. Many built their organic programs on educational content that attracts early-stage researchers, then relied on retargeting and email to convert a small share of them. If the top of that funnel shrinks, the pipeline feels it months later, after the reports have moved on to other worries. At the same time, buyers closer to a decision still search for comparisons, alternatives, pricing and reviews, and those queries have held up better in at least some reporting.
The shift also changes what visibility means. A brand can appear in a generated answer without receiving a click, and a buyer can form an impression of a vendor from a summary alone. Treating impressions and mentions as meaningless would be a mistake, and so would treating them as equal to visits. The sensible approach is to measure both, learn which queries still send buyers to you and rebuild the parts of the program that depended on clicks that no longer arrive.
What the studies report
- Ahrefs reports a 58% drop in top-result click-through rate. A MediaNama article dated February 6, 2026 reports a study by Ahrefs authors Ryan Law and Xibeijia Guan using 300,000 keywords, half of which triggered an overview, with December 2025 data compared against December 2023. It also reports second and third positions down 50.8% and 46.4%, and cites an earlier April 2025 study showing a 34.5% drop. The article says the study measured desktop only.
- Seer Interactive reports a 61% organic drop on informational queries. A secondary roundup by Alper Ozturk, published February 8, 2026, summarizes a Seer study of 3,119 informational queries across 42 organizations from June 2024 to September 2025, with organic click-through falling from 1.76% to 0.61%. It adds that pages cited in an overview earned 35% more organic clicks. I haven’t checked the original study, and the roundup is a secondary source.
- Pew Research Center reports a smaller absolute effect. The roundup says a July 2025 Pew study of 900 U.S. adults, using March 2025 browsing data, found 8% of visits with an AI summary clicked a traditional result, against 15% without a summary, and that 1% of visits clicked a link inside the summary. It also says Google called the methodology flawed. Pew measured browsing behavior rather than a particular site’s click-through rate.
- Amsive reports a smaller average decline. The roundup says an A massive analysis of 700,000 keywords across 10 sites found average click-through down 15.49%, non-branded down 19.98% and branded up 18.68%. That last figure matters because it contradicts the claim that every study found declines. It suggests branded queries may hold up or even gain, though the roundup doesn’t say whether the changes are relative or in percentage points. Check your own branded trend before you assume otherwise.
Why the numbers disagree
The studies measure different things. Some compare click-through rates on keywords with and without overviews, some track the same keywords over time, some measure browsing behavior from panels and some report a single publisher’s internal data. The roundup lists Daily Mail’s desktop rate falling from 25.2% to 2.8%, a figure from a single company that says its overall traffic impact is small. Comparing an 89% drop on a single publisher to a 15% drop across 10 sites tells you little.
The reported arithmetic doesn’t always reconcile. The MediaNama article gives informational top-result rates of 0.076% in December 2023 and 0.039% in December 2025, which is a drop of about 49% on my arithmetic, and keywords with overviews falling from 0.073% to 0.016%, about 78%. The article doesn’t explain how it reached 58%. Seer’s 1.76% to 0.61% is about 65%, not 61%. The percentages as printed also look very small, so I can’t tell whether the units are right. Verify figures against the original studies.
Prevalence estimates conflict. The roundup cites Semrush at 15.69% of queries showing an overview in November 2025 and Advanced Web Ranking at 49.92% in the fourth quarter. Different keyword sets and definitions likely explain the gap. If you read that overviews appear on a given share of searches, ask which keywords were counted. A B2B software site cares about the share of its own target queries, which may differ greatly from a general sample of 10 million keywords.
Correlation isn’t the cause. The MediaNama article notes that featured snippets, local packs and top stories also contribute to searches that end without a click, so declines can’t be attributed only to overviews. Similarweb’s rise in searches that end without a click from 56% to 69%, cited in the roundup, shows that more searches end without a click, but it doesn’t prove the cause. Treat the studies as evidence that clicks are under pressure, and use your own data to learn how much.
Which queries lose clicks first
The table summarizes where the sources suggest clicks hold up or fall. The source column notes where each claim comes from, and the last column is my judgment rather than sourced data. Growfusely’s post says informational and definitional queries get absorbed first while comparison and evaluation queries hold up better, but it gives no sample size. Treat the pattern as a hypothesis to test against your own query data before you reorganize your content plan around it.
| Query type | What the sources suggest | Source and caveat | My judgment |
| Definitions and basic how-to | Absorbed first | Grow fusely; no sample stated | Lowest click value, highest risk |
| Comparisons and alternatives | Hold up better | Growfusely; own study of citations | Protect and expand |
| Pricing and evaluation | Hold up better | Growfusely; same caveat | Keep current and specific |
| Branded queries | Clicks may rise | Amsive, via a roundup; unclear metric | Check your own branded trend |
| Position 2 and 3 informational | Also fall sharply | Ahrefs, via MediaNama; 50.8% and 46.4% | Ranking lower offers little shelter |
| Transactional | Smaller declines in a single vertical | Techmagnate, via a roundup; finance only | Verify for your market |
How to diagnose your own drop
- Start with impressions against clicks. Growfusely’s post describes a pattern in which impressions hold steady while clicks fall, and says it usually points to answers absorbing clicks rather than to lost rankings. The author calls it common in business software but gives no sample. Export a year of page and query data, compare the first and last quarters, and look for pages whose impressions held while clicks fell by a third or more.
- Segment by query type before you draw conclusions. Group queries into definitional, how-to, comparison, pricing, branded and other, then compare click trends for each. If the losses concentrate in definitional queries, the cause is probably generated answers. If they spread across comparison pages, look for competitor changes, content decay or technical problems. A single site-wide number hides these differences and leads to the wrong fix. Review each group every month so trends show early.
- Check rankings and position changes. If the average position fell on pages that lost clicks, the cause is ranking, not answers. Look at position by query and compare against a rank tracker, if you use a tool. Also check for technical changes such as migrations, redirects, canonical tags and indexing problems. Those causes are recoverable with standard fixes, and confusing them with absorbed clicks wastes the months you could have spent repairing real damage.
- Look at seasonality and market shifts. Business traffic follows budget cycles, holidays and conferences. Compare year over year rather than only month over month, and check whether your total market search demand moved. A fall in demand for a category is a different problem than a fall in your share. Also check whether new competitors or review sites started ranking for your terms, since displacement can look like absorbed clicks.
What the reporting tools show
Google’s documentation says traffic from AI Overviews and AI Mode is included in overall Search Console data and reported under the Web search type in the Performance report. That means you can’t isolate those clicks with a built-in filter today. It also says clicks from AI Overviews tend to be higher quality, with users more likely to spend time on the site. That’s Google’s claim and I haven’t seen independent verification, so compare engagement and conversion on your own pages before you rely on it.
A June 3, 2026 note by Nathan Yendle of Priority Pixels describes a new Search Console report on generative AI features in limited testing with a subset of UK site owners. It shows impressions for content appearing in AI Overviews and AI Mode, by page, country, device and date. It can’t show clicks from those surfaces, so it gives no click-through rate. It also lacks query-level data, conversion attribution and session engagement. The author calls the missing click data the more consequential gap.
Because the tools are incomplete, build your own picture. Pair Search Console with your analytics, a rank tracker, call and demo records and a manual check of the queries that matter most. Search them yourself, note whether an overview appears, record which sources it cites and whether your brand appears, and repeat monthly. That’s labor-intensive, so limit it to your top 50 queries, and write down the date and location of each check because results vary.
Sorting losses by cause
Recoverable losses come from fixable problems. Growfusely lists content decay, migration issues, competitive displacement and comparison-query loss as recoverable. If a page slipped because it’s outdated, thin or poorly linked, a refresh can win back position and clicks. If a migration broke redirects or canonicals, repairing them can restore traffic that never went away on its own. These are the cheapest wins, so start here before you rewrite your strategy around a threat you haven’t confirmed.
Some losses won’t return as clicks. The Growfusely post says fully answered informational queries aren’t recoverable as clicks, which is an assertion rather than a tested result. The logic is plausible: if a searcher gets a complete answer from the summary, no page can pull them in. The sensible response is to stop measuring those pages by visits, decide whether they still serve a purpose and consider whether another channel can reach the same audience.
Some losses are recoverable only as citations. When an overview cites your page, the searcher sees your brand and may click, and the roundup’s Seer figures say cited pages earned 35% more organic clicks than uncited ones. That’s a correlation rather than proof that citation causes clicks. Even so, being cited beats being absent, and it gives you a reason to improve the pages that supply the facts the overview uses, especially original data, clear definitions and well-structured explanations.
Sorting forces decisions. Put each lost page into 1 of the 3 buckets using the diagnosis above, then assign an action. Fix the first bucket, rethink the metric for the second and invest in citation-worthy material for the third. Without sorting, teams spend equal effort on every page, which wastes money on pages that can’t recover and neglects pages that could. Review the sorting each quarter, because the picture changes as Google changes its features.
Recovery actions by page type
The table assigns actions and metrics to the page types most business sites have. It’s my judgment, built from the sources and the logic of the funnel, and you should test it on a few pages before you apply it across the site. The pattern is to protect pages that earn demos, repurpose pages that attract research and measure each by the outcome it can still deliver. Page types that no longer send visits may still earn mentions and email signups.
| Page type | Action | Metric to watch |
| Comparison and alternatives | Update quarterly with specific, dated facts | Clicks, demo rate, citations |
| Pricing and packaging | State what’s included and who it fits | Demo rate, time on page |
| Product and solution pages | Match language buyers use in evaluations | Conversion rate, branded clicks |
| Definitions and explainers | Add original data or a tool; consider consolidating | Citations, email signups |
| Case studies | Add numbers, roles and timelines | Assisted conversions |
| Original research | Publish methods and downloadable data | Citations, links, mentions |
| Thin or outdated posts | Refresh, merge or remove | Index coverage, impressions |
Protect the pages that earn demos
Evaluation pages deserve first attention because they carry the most commercial value. Growfusely says comparison, alternatives and evaluation queries hold up better than informational ones, though its sample isn’t stated. In the invented model later, informational pages bring 60% of clicks but only 20% of demos, which is typical of a funnel in which early readers rarely convert. Whatever your numbers, learn which pages produce demos, and make sure those pages get the best maintenance and the most careful editing.
Keep these pages current, specific and honest. Buyers comparing vendors want pricing ranges, integrations, implementation time, support terms and the types of company a product fits. A page that avoids these details gives a generated summary little to quote and gives a buyer little reason to stay. Name competitors fairly, state where your product is a poor fit and cite the source and date of every figure. Pages that read like brochures lose to independent reviews that answer the buyer’s real questions.
Review these pages on a schedule. Assign an owner for each, set a quarterly check for pricing, features and competitor changes, and record the date of the last update on the page. Stale comparison pages do more harm than no page, because a buyer who catches an error stops trusting the rest. Track clicks, demo conversion and branded searches for each page, and investigate when any of them moves by more than a set threshold in a month.
Build assets worth citing
- Publish original data. Growfusely recommends original and comparative data as citable assets. A survey of your customers, an analysis of anonymized product usage or a benchmark from your own work gives writers and summaries something they can’t get elsewhere. Publish the sample size, dates, method and limits next to the numbers, and keep the data downloadable. Invented or vague statistics invite correction and damage trust, so use only what you can defend.
- Write clear definitions and direct answers. Even if summaries absorb some clicks, being the source they draw from has value, and the Seer figure in the roundup suggests cited pages fared better. Put the answer in the first lines of the page, then give detail, examples and caveats below it. Google’s documentation says no special markup is needed, so write for readers and keep the page crawlable and indexed. Update them when the facts change.
- Earn mentions on independent sources. Growfusely’s own study of 1,739 citations across 128 software purchase queries on ChatGPT and Perplexity found about 79% came from independent sources and vendor comparison pages, with review platforms such as G2 and Capterra at 7.3%. The author produced that study, and the post gives no dates or query selection method. The direction still makes sense: assistants and summaries draw on pages beyond your own site, so reviews, analyst notes and trade coverage matter.
- Make expert authorship visible. Add author names, roles and credentials to articles, explain how you tested claims and link to primary sources. Readers and editors trust named experts more than anonymous copy, and a page with clear sourcing is easier to quote accurately. This isn’t a guarantee of citation, since Google says there’s no special treatment, but it improves quality for human readers, who still decide whether to book a demo.
Technical and entity basics
Follow Google’s own guidance. Its documentation says a page is eligible as a supporting link if it’s indexed and eligible to appear in Search with a snippet, and that there are no additional requirements for AI Overviews or AI Mode. It says you needn’t create machine-readable files, AI text files or special markup, and there’s no special schema to add. Standard practice still applies: allow crawling, link pages internally, keep structured data consistent with visible text and fix indexing errors.
Keep your brand description consistent. Growfusely recommends making the brand’s name, description and category consistent so engines recognize it as an entity. Check your website, social profiles, review listings, directory entries and press boilerplate, and align the way each describes what you sell and who you serve. This costs little and reduces confusion. It’s a vendor’s recommendation without a stated test, so measure whether branded queries and mentions improve rather than assuming gains.
Understand the snippet controls before you use them. Google’s documentation says you can limit what appears from your pages using nosnippet, data-nosnippet, max-snippet or noindex, and that Google-Extended is a separate control for some AI training and grounding uses. These controls can reduce your exposure in summaries, but they may also reduce visibility and clicks in regular results. Decide deliberately, test on a few pages and allow time, since Google says recrawling can take from several days to several months.
An illustrative impact model
An invented site receives 30,000 organic clicks a month. Informational pages bring 18,000 of them and convert to demos at 0.5%, or 90 demos, while evaluation pages bring 12,000 clicks at 3%, or 360 demos, for 450 demos in total. Suppose informational clicks fall 40% and evaluation clicks fall 10%. Every input is invented, including the conversion rates, a 20% close rate and a $15,000 average deal, and I recomputed the arithmetic.
| Item (invented) | Before | After | Change |
| Informational clicks | 18,000 | 10,800 | Minus 40% |
| Evaluation clicks | 12,000 | 10,800 | Minus 10% |
| Total clicks | 30,000 | 21,600 | Minus 28% |
| Informational demos at 0.5% | 90 | 54 | Minus 36 |
| Evaluation demos at 3% | 360 | 324 | Minus 36 |
| Total demos | 450 | 378 | Minus 16% |
| Deals at 20% close | 90 | 75.6 | Minus 14.4 |
| Pipeline value at $15,000 | $1,350,000 | $1,134,000 | Minus $216,000 |
Clicks fall 28% but demos fall 16%, because evaluation pages carry 80% of the demos and lost less. The lesson is that a drop in total visits overstates the commercial damage when losses concentrate in low-converting pages, and it understates the risk if evaluation pages begin to lose clicks too. Replace each invented number with your own data, and rerun the model for a few scenarios before you present it to leadership.
Measuring recovery honestly
Choose measures that match the goal. For pages that earn demos, track clicks, demo conversion and pipeline sourced or influenced by organic search. For pages that now earn visibility rather than visits, track citations, branded search volume and assisted conversions. Report the 2 groups separately so a loss of low-value visits doesn’t hide a gain in valuable ones. Also record the date of every change so that you can match movements to actions.
Sample citations by hand and with tools. Choose 30 to 50 queries that matter to your pipeline, search them monthly, record whether an overview appears and note which sources it cites and whether your brand is among them. Growfusely suggests tracking citation share for priority prompts alongside sessions. Tools that automate this vary in quality and I haven’t tested them, so check their method, sample and refresh rate, and treat a tool’s score as an estimate rather than a fact.
Be candid with leadership about what can’t be measured. Search Console doesn’t yet separate clicks from AI surfaces, as the Priority Pixels note explains, and assistants such as ChatGPT or Perplexity may influence buyers without appearing in your reports at all. Say so, show the measures you do have, and describe the tests you’re running. Leaders prefer a clear account of uncertainty to a confident story that falls apart when a quarter ends badly.
Mistakes teams make
- Treating every lost click as a ranking problem. Teams often respond to a traffic drop by rewriting content or building links, when the cause is answers absorbing clicks for informational queries. Diagnose first. Compare impressions, clicks and position by page and query type, and fix technical and content problems before changing the strategy. A rewrite of pages that were never losing rankings wastes months and may damage pages that were working.
- Chasing citations at the expense of conversion. Citations are visible, but a citation without a click or a conversion doesn’t pay a salary. Focus on the pages and queries tied to demos, and use citations as supporting evidence. Growfusely’s recommendations favor protecting comparison and evaluation pages for this reason. Keep revenue as the test, and judge every initiative by what it does to demos and pipeline over a sensible period.
- Believing the headline numbers. The studies differ in method, sample and period, and some of the reported arithmetic doesn’t reconcile. A figure like 58% or 89% says little about your site. Use the studies as context and your own data as the basis for decisions. When someone quotes a statistic in a meeting, ask where it came from, what it measured and whether it applies to business queries like yours.
- Ignoring other channels. If organic search shrinks, the funnel needs other sources of demand: email, communities, partners, events and direct relationships. Don’t rebuild a single channel and hope. Review where your best customers first heard of you, and invest where that happens. Search remains important, yet a team that depends on a single source of demand is exposed to the next change, whatever form it takes. Ask recent customers where they first heard of you.
A 90-day recovery plan
Days 1 to 30: diagnose and sort. Export page and query data for the last 12 months from Search Console and your analytics. Find pages where impressions held and clicks fell by a third or more, group queries by type and sort losses into recoverable, unrecoverable as clicks and recoverable as citations. Fix obvious technical errors, such as broken redirects and indexing problems. List the 20 pages that earn the most demos and assign an owner to each.
Days 31 to 60: protect and publish. Refresh the evaluation pages with current pricing, integrations, comparisons and dated facts. Start a single original research project, such as a customer survey, with a defined method and a publication date. Align your brand description across your site and external profiles. Begin monthly checks of 30 to 50 priority queries to record whether summaries appear and which sources they cite. Keep a change log with dates.
Days 61 to 90: measure and decide. Compare clicks, demo conversion and citations for the pages you changed against a control group of similar pages you left alone, if you can. Publish the research, pitch it to trade outlets and customers and track mentions. Report to leadership with the invented-model logic applied to your real numbers: what changed, what the data can’t show and what you’ll do next. Decide which pages to consolidate or retire.
FAQs
How much have Google AI Overviews reduced clicks?
Studies range widely. A February 2026 report on an Ahrefs study says top-ranked results lost 58% of their click-through rate when an overview appeared, based on December 2025 desktop data, while a roundup cites an Amsive analysis with an average decline of 15.49% and a rise in branded clicks. The methods differ and some figures don’t reconcile. Measure your own pages by query type before relying on any headline. Treat every headline as context.
Why are my impressions steady while clicks fall?
Growfusely’s post says steady impressions with falling clicks usually signal answers absorbing clicks, not lost rankings, and calls the pattern common in business software, without a stated sample. Confirm by checking average position, query type and technical changes. If losses concentrate in definitional queries, answers are the likely cause. If they spread across comparison pages, look for decay, competitors or migration problems. Fix the cheap causes first, then rethink the metric for pages that can’t recover.
Which pages should I protect first?
Protect pages that produce demos, usually comparison, alternatives, pricing and product pages. Growfusely says evaluation queries hold up better than informational ones, though its sample isn’t stated. In the invented model in this article, evaluation pages bring 40% of clicks and 80% of demos. Check your own data, assign owners, update the pages quarterly and track clicks and demo conversion for each. Review the list each quarter as the data and the results change.
Do I need special markup to appear in AI Overviews?
Google’s documentation says no. A page is eligible as a supporting link if it’s indexed and eligible to appear in Search with a snippet, and there’s no special schema or machine-readable file to add. Standard practice still applies, such as allowing crawling, internal links and structured data that matches visible text. Treat vendor claims about secret formatting tricks with caution, and test any change. Check Google’s documentation for updates before you change anything.
Can Search Console show me clicks from AI Overviews?
Not separately, as of the sources I read. Google’s documentation says traffic from AI Overviews and AI Mode is included in overall data under the Web search type. A June 2026 Priority Pixels note describes a limited test report showing impressions for generative AI features but no clicks, queries or conversions. Build your own tracking with analytics, rank checks and manual query reviews. Record the date and location of every check, since results vary.
Is it worth trying to get cited in AI answers?
Often, but keep it in proportion. The Seer figures in a secondary roundup say cited pages earned 35% more organic clicks than uncited ones, which is a correlation. Growfusely recommends original data, consistent brand descriptions and independent mentions. Citations help visibility, yet demos and pipelines pay the bills, so judge every effort by what it does to those outcomes and track both. Review the results with finance each quarter, with the pipeline as the test.
Should I stop publishing informational content? Not automatically. Informational pages may lose clicks first, but they can still earn citations, links, email signups and trust. Review each page: refresh those that serve a purpose, add original data or tools to those that could earn citations and consolidate or remove thin pages. Stop judging them by visits alone, and decide with data on what each page contributes to demos. Revisit each page every 6 months, because query behavior keeps shifting.
What should I tell the leadership about the drop?
Say how much of the drop is traffic and how much is demos, which pages are affected, what’s recoverable and what you’re doing about it. Explain that studies disagree, that Search Console doesn’t yet isolate AI clicks and that you’ll track citations and conversions as best you can. Share the plan, the measures and a review date, and use your real numbers in place of the invented ones. Offer a date for the next review.