What Is a Good Landing Page Conversion Rate for B2B?
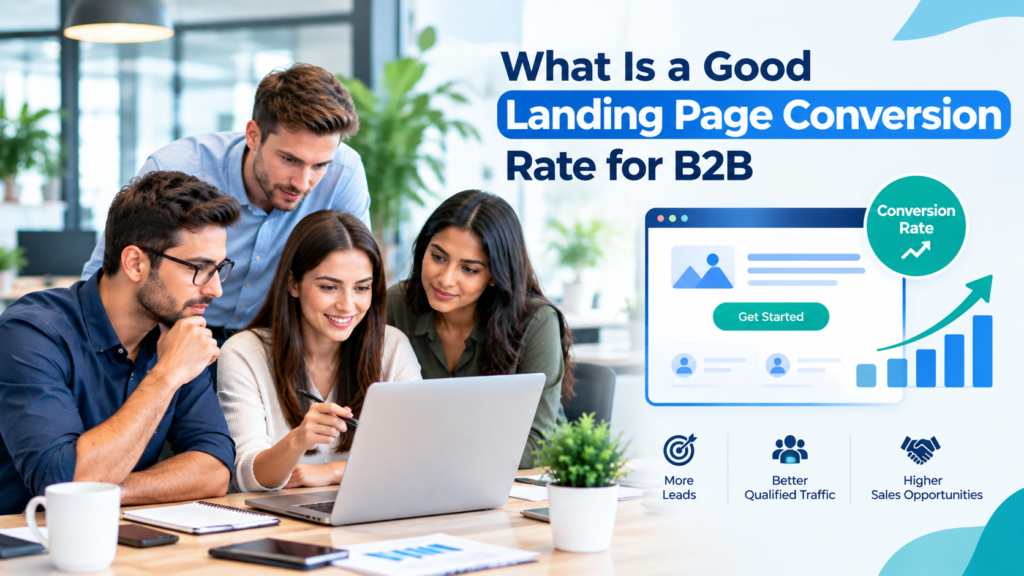
A good B2B landing page conversion rate is useful only when the number matches the action you want a visitor to take. A demo request, a contact form, a webinar registration, and a gated guide can all sit on landing pages, yet each asks for a different level of commitment. That makes a single universal benchmark a weak way to judge performance.
Current research supports a more practical view. Unbounce reports a 6.6% median across all industries, but its SaaS median is 3.8% and its commercial and professional services median is 6.1%. Those figures come from landing-page data, while other benchmark studies use whole-site sessions, calls, qualified leads, or sales. The measurement unit matters as much as the percentage.
For SaaS and professional services teams, a B2B landing page conversion rate in the 3% to 6% range can serve as a useful reference for lead-generation pages, provided the traffic and conversion action are comparable. That band reflects Unbounce’s category medians, and B2B-only data tends to run lower, so it works best as a reference for those categories. A lower rate can still be healthy when the page asks for a high-commitment sales conversation. A higher rate can be weak if the form attracts people who never become qualified opportunities.
This guide explains how to read a landing page conversion rate benchmark, compare B2B landing page benchmarks without mixing unlike datasets, and judge a B2B conversion rate in the context of traffic quality and sales motion. It also covers measurement, form design, page speed, testing, and lead quality so the rate connects to the pipeline instead of becoming an isolated marketing number.
TL;DR
A good B2B landing page conversion rate depends on what the page asks visitors to do, where those visitors came from, and what happens after the form is submitted. Unbounce’s current benchmark report puts the all-industry landing-page median at 6.6%, while SaaS sits at 3.8% and commercial and professional services at 6.1%. Those medians offer context, but they shouldn’t be used as universal targets.
Use roughly 3% to 6% as a practical reference band for SaaS and professional services lead-generation pages, and expect lower rates in B2B-only studies. Then narrow the comparison by industry, offer, traffic source, device, and sales motion. Judge the lead generation conversion rate together with qualified-lead rate, opportunity rate, and cost per qualified opportunity. If a page produces more form fills but fewer viable deals, the higher conversion rate hasn’t improved the business result.
The most useful benchmark is your own page measured consistently over time. External B2B landing page benchmarks tell you where to investigate. Your internal baseline tells you whether a change actually helped.
What a B2B landing page conversion rate measures
A B2B landing page conversion rate is the percentage of landing-page sessions or users that complete the action defined as a conversion. The basic formula is conversions divided by landing-page sessions, multiplied by 100. Some teams divide by users instead, which works as long as the choice stays fixed, because the 2 methods produce different rates. The formula is simple. The definition of a conversion is where most reporting problems begin.
Google Analytics now separates key events from advertising conversions. In its current guidance, Google explains that a key event is an action important to the business, while a conversion is an important action used for ad measurement and bidding. That distinction matters because a team can mark several useful behaviors as key events without treating every one of them as the final conversion used to judge campaign performance. The Google Analytics explanation of key events and conversions gives teams a clear measurement model, and it helps prevent scroll depth or a button click from being mixed with a completed demo request in the same headline rate.
For a B2B page, the conversion action should match the page’s job. A product-demo page may count a valid demo form submission. A webinar page may count a completed registration. A contact page may count a form submission or tracked call. If the page supports several actions, report them separately before creating a blended rate.
That discipline is especially important when the B2B conversion rate is used in budget decisions. A page with a high number of low-value actions can appear strong while producing little pipeline. A page with fewer submissions may create better opportunities because its action requires more intent.
What is a good B2B landing page conversion rate?
A good B2B landing page conversion rate is one that compares well with pages serving the same audience and conversion action, while still producing qualified pipeline. As a practical starting point, about 3% to 6% is a reasonable reference band for SaaS and professional services landing pages, where Unbounce counts any page goal as a conversion. That range is an interpretation of current industry medians, not a rule that every page should reach. B2B-only data sits lower. A 2026 study of landing pages at 83 B2B companies reported average rates of about 1.8% to 3.5% depending on page type, with B2B SaaS pages at 1.1%.
The broadest current landing page conversion rate benchmark from Unbounce is 6.6% across all industries. Its report is based on more than 41,000 landing pages, 464 million unique visitors, and 57 million conversions. The 2024 Conversion Benchmark Report also shows that industry medians vary widely, which is why a cross-industry number should be treated as context rather than a pass-fail line.
B2B categories can sit below or near that overall median. Unbounce reports a 3.8% median for SaaS landing pages, based on the same benchmark program. The SaaS conversion benchmark is especially useful for software marketers because the category often includes demo requests, trial signups, and gated resources, all of which can create different levels of friction.
Commercial and professional services show a different pattern. Unbounce reports a 6.1% median for those landing pages. Its professional services benchmark also notes substantial variation within the category. A law firm, consulting business, repair service, and accounting firm don’t create the same visitor intent even when all are grouped under services.
The practical answer is therefore conditional. A 3.5% demo-request rate may be healthy for an enterprise software offer with expensive contracts and a long buying cycle. The same 3.5% could be weak for a low-friction webinar registration page receiving warm email traffic. The conversion action and visitor intent have to be matched before the number means anything.
Current B2B landing page benchmarks by industry and dataset
B2B landing page benchmarks make more sense when the source and measurement method are visible beside the number. Landing-page datasets, whole-site datasets, and attribution platforms don’t count the same behavior. Mixing them creates false comparisons.
| Benchmark Source | What It Measures | Reported Rate | How to Use It |
| Unbounce, all industries | Landing-page conversions | 6.6% median | Broad reference only |
| Unbounce, SaaS | SaaS landing-page conversions | 3.8% median | Useful for software landing pages |
| Unbounce, commercial and professional services | Service landing-page conversions | 6.1% median | Useful for B2B service pages |
| Ruler Analytics, all industries | Qualified leads or sales across tracked sessions | 5.13% average | Useful for channel and whole-site context |
| Ruler Analytics, software | Qualified leads or sales across tracked sessions | 7.6% average | Useful for software journey context, not a direct landing-page comparison |
| Ruler Analytics, professional services | Qualified leads or sales across tracked sessions | 6.1% average | Useful when forms and calls are both tracked |
A newer 2026 dataset from Ruler Analytics adds another view. Its study covers more than 110 million sessions and 5 million conversions across 13 industries, with conversion defined as a qualified lead or sale. The 2026 conversion rate benchmark study reports a 5.13% overall average, 7.6% for software, and 6.1% for professional services. Those figures shouldn’t replace landing-page medians because the dataset includes broader website journeys, channel differences, and offline conversion paths.
The difference between these sources is useful. It shows why a landing page conversion rate benchmark should carry a label that states the denominator, the conversion action, and the audience. A percentage without those details is easy to repeat and hard to use.
Median versus average
Median and average rates also answer different questions. A median shows the midpoint of the observed pages, which reduces the effect of very high or very low outliers. An average adds all results and divides by the number of observations, so extreme values can move the result.
When comparing B2B landing page benchmarks, keep the statistic type visible. A 6% average shouldn’t be treated as directly equal to a 6% median. The safest comparison uses the same source, same statistic, same page type, and similar traffic conditions.
Why benchmarks can mislead B2B teams
Benchmarks become misleading when they remove the context that caused the rate. A visitor who searched for a product category and clicked a search ad is behaving differently from someone who clicked a broad social post. A visitor returning from a sales email already knows the company. Their likelihood of completing a form won’t be the same.
Traffic intent is only one source of variation. B2B purchases often involve several people and a long research period. LinkedIn’s 2025 analysis describes B2B buying journeys as nonlinear and cross-channel, with buyers moving across devices and sources before they engage with sales. The LinkedIn review of current B2B buyer trends helps explain why a last-click landing page can receive credit for demand that was built elsewhere, while another page may influence a later conversion without receiving the form submission itself.
Buying groups also change how a page should be judged. LinkedIn’s research with Bain reports that group decision-making, brand familiarity, and internal confidence affect B2B choices. The LinkedIn discussion of group buying and brand trust reinforces an important point for landing pages: the visitor completing a form may need enough information to satisfy colleagues who never visit the page.
This is why a B2B conversion rate shouldn’t be read as a full measure of persuasion. The number captures a visible action. It doesn’t capture every prior touchpoint, private recommendation, sales interaction, or internal approval that shaped the decision.
A useful benchmark comparison therefore controls for as much context as possible. Compare paid search with paid search, demo requests with demo requests, and similar markets with similar markets. Then use the external figure to ask questions about your page rather than treating it as a universal target.
How conversion goals change the rate you should expect
The conversion action sets the amount of commitment the page asks from a visitor. That is why any landing page conversion rate benchmark must be tied to a clearly defined action. A low-friction action usually has a larger pool of people willing to complete it. A high-friction action screens more visitors out before the form is submitted. Both can be useful if the action fits the funnel stage.
Demo and contact requests
A demo request asks the visitor to identify themselves and accept a likely sales follow-up. In enterprise B2B, it may also ask for company size, role, business need, or timeline. Those fields can help qualification, but they raise the effort required to convert.
For this page type, the raw B2B landing page conversion rate should be paired with the share of submissions that become qualified meetings. A smaller volume of relevant requests can be more valuable than a larger volume of students, vendors, job seekers, or poor-fit companies.
Trials and product signups
A trial or product signup can feel easier than a sales call when the product allows self-service evaluation. The rate still depends on what happens after signup. If many visitors create accounts but few activate the product, the landing page may be attracting curiosity rather than useful demand.
The lead generation conversion rate should therefore be followed by activation or product-qualified behavior. That keeps the page from being rewarded for signups that never reach meaningful use.
Webinars, guides, and other gated content
A registration or content-download form usually asks for less commitment than a demo request. It can therefore produce a higher conversion rate while representing an earlier buying stage. That doesn’t make the page stronger or weaker by itself. It means the action measures interest rather than direct sales intent.
For gated content, report the initial conversion separately from later qualification. The lead generation conversion rate can then be read as an interest signal instead of a sales-ready lead rate. This prevents a high form-completion rate from being compared directly with a demo page that serves a different job.
How traffic source changes conversion performance
Traffic source can move the B2B landing page conversion rate even when the page itself doesn’t change. Search, email, organic content, paid social, direct visits, and referral traffic bring visitors with different levels of awareness and intent. A useful analysis segments the page by source before making design changes.
Paid search often carries explicit intent because the visitor entered a query before clicking. Google states that landing page experience is influenced by the usefulness and relevance of the page, ease of navigation, and whether the page meets expectations created by the ad. The Google Ads landing page guidance supports a simple rule for B2B campaigns: the page should answer the promise made in the ad instead of forcing the visitor to reinterpret the offer after the click.
Google also treats landing page experience as one component of Quality Score alongside expected clickthrough rate and ad relevance. Its Quality Score guidance for landing pages recommends consistent messaging, mobile-friendly pages, and fast loading. Those factors matter for conversion as well because they reduce the gap between visitor expectation and page experience.
Email traffic can behave differently because the recipient may already know the company or offer. Direct traffic can include returning prospects, branded demand, and unattributed visits. Organic search can range from early educational intent to a highly specific product comparison query. Paid social often reaches people who weren’t actively searching at the moment of the click.
This variation is why a single blended B2B conversion rate can hide useful information. The same problem applies to a lead generation conversion rate that combines every channel into one figure. If paid search converts at one rate and paid social at another, that doesn’t automatically prove the page is the problem. The source may be creating a different intent mix.
How sales motion and deal size change the benchmark
Sales motion determines what a conversion means after the landing page. A self-service product can move from visit to signup with little human involvement. A complex B2B service may require discovery calls, technical review, procurement, security checks, and several approvals after the first form submission.
As commitment rises, the landing-page form becomes a gate into a longer process. A lower B2B landing page conversion rate can be acceptable if the page produces qualified opportunities that fit the contract value and buying requirements. A higher rate can create extra sales work if the page lowers the barrier so far that qualification shifts entirely to the sales team.
Deal size also changes the visitor’s risk calculation. A buyer considering a small monthly tool can act with limited internal approval. A buyer considering a large annual contract may need proof about implementation, security, integration, support, or business fit before submitting a form. The page has to answer enough of those concerns to make the next step feel reasonable.
This is where B2B landing page benchmarks should be segmented by sales motion when possible. A product-led signup page and an enterprise demo page can belong to the same software category while serving different buying processes. Their rates shouldn’t be held to the same expectation.
How to measure the rate correctly in GA4 and ad platforms
Accurate measurement starts with one agreed conversion definition. Marketing, sales, and analytics teams should know which event counts as the landing-page conversion and which later events represent qualification or revenue. If each tool uses a different definition, the same page can appear to have several conversion rates.
Start by confirming that the form success event fires only after a valid submission. Then test duplicate submissions, page refreshes, validation errors, and thank-you page behavior. If calls count as conversions, use call tracking that can connect the call to the source without double-counting a visitor who also submits a form.
Google Ads provides a landing-pages report that can be used to review the pages receiving ad traffic and check mobile experience. Its landing-page performance guidance also points to page speed as an important factor. Paid teams should use this report beside conversion data rather than judging ads only from click and cost metrics.
A clean reporting structure separates at least 2 levels. This keeps the lead generation conversion rate distinct from later qualification metrics. The first is the page conversion itself, such as a completed form. The second is the business outcome, such as a qualified meeting or opportunity. More stages can be added where the sales process needs them, but the first conversion shouldn’t be renamed each time a lead moves through the funnel.
Segment before you diagnose
Segment the B2B landing page conversion rate by source, device, campaign, geography, and new versus returning visitors where sample size allows. That can reveal a problem hidden by the overall rate. A page may perform well on desktop and poorly on mobile, or work for branded search while missing the intent of nonbrand terms.
Keep the denominator consistent when comparing periods. A B2B conversion rate becomes much easier to interpret when the reporting unit stays fixed. If one report uses sessions and another uses users, the rates can differ even when the underlying behavior hasn’t changed. The same rule applies to attribution windows and conversion counting settings.
What usually holds B2B landing page conversion back
Most weak pages don’t fail because they lack enough sections. They fail because the visitor can’t quickly connect the page with the reason they arrived, or because the next step asks for more effort than the page has earned. Diagnosis should begin with message match and form friction before cosmetic changes.
Weak message match
The headline should confirm that the visitor reached the right page. If an ad promises a specific service, use case, or problem, the landing page should continue that subject directly. A broad corporate headline can force the visitor to search the page for the promised information.
Message match also affects paid search quality. Google’s current guidance says landing page experience considers relevance, usefulness, and whether the page meets expectations created by the ad. That makes the headline, supporting copy, and offer part of the same path rather than separate creative tasks.
Forms that ask for too much too early
Every field should have a reason to exist at the moment of conversion. A sales team may want detailed qualification data, but the landing page pays the cost when visitors are asked for information that could be collected later.
Nielsen Norman Group’s 2025 guidance recommends reducing form effort by removing unnecessary questions and making the remaining interaction easier. The EAS framework for simplifying forms is useful for B2B teams because it gives each field a practical test: remove what isn’t needed, automate what can be inferred safely, and simplify the rest.
Form clarity matters as well as field count. Labels should be visible, required fields should be clear, and errors should explain how to recover. Nielsen Norman Group’s web UX study guide for forms gathers current guidance on form structure, labels, errors, and cognitive load, all of which can affect whether a visitor finishes the task.
Slow or unstable pages
Page speed can reduce the number of visitors who stay long enough to convert. The effect varies by audience and site, so teams should measure their own pages rather than repeating a universal speed-to-conversion claim.
Real case studies still show why performance deserves attention. T-Mobile reported a 42% reduction in Largest Contentful Paint and a 60% improvement in prospect visit-to-order rate during its performance program. The T-Mobile web performance case study doesn’t prove the same lift will occur on a B2B lead page, but it shows that page responsiveness can be tied to business outcomes when teams measure it carefully.
QuintoAndar also reported a 5% improvement in conversion during validation after work on page performance, alongside lower bounce rates and better engagement. Its Core Web Vitals case study is another reminder that technical page quality belongs in conversion diagnosis rather than being treated only as an SEO task.
Proof that doesn’t answer buyer risk
B2B proof should reduce uncertainty about the next step. A row of logos can show market presence, but a buyer may need proof tied to their industry, use case, security concern, or implementation model. The best proof depends on what could stop the visitor from submitting the form.
Use specific customer evidence where permission allows. Explain what changed, who the work was for, and what conditions shaped the result. Avoid claims that can’t be checked or that hide important limits.
How to improve a B2B landing page conversion rate
Improving a B2B landing page conversion rate starts with diagnosis, because the same change can help one audience and hurt another. Use analytics, ad data, form data, and sales feedback to identify the largest break in the path before changing the page.
First, confirm that the page matches the traffic. Compare the query, ad, email, or referral message with the headline and offer. If a visitor arrives for a specific need, make that need visible near the top of the page. Keep the main action clear and remove competing actions that don’t help the visitor decide.
Second, review the form as a business exchange. Ask whether each field is needed before the next step can happen. If sales can collect a detail during discovery, removing it may reduce form effort. If a field is essential for routing or qualification, explain it clearly rather than hiding the reason.
Third, make proof answer real buyer concerns. Customer examples, security details, implementation expectations, and product evidence can support different kinds of decisions. Choose the evidence that matches the page’s audience instead of filling space with generic trust badges.
Fourth, fix technical friction. Test the page on real mobile devices, check form behavior, review page speed, and verify that errors don’t erase entered data. A landing page can have strong copy and still lose conversions because the interaction fails at the moment a visitor tries to act.
Fifth, connect the lead generation conversion rate to downstream quality. Review which submissions become qualified meetings and opportunities. If the page rate rises while qualified pipeline falls, the page may be attracting a broader but weaker audience.
A short checklist can keep the review focused:
· The headline matches the promise that brought the visitor to the page.
· The main conversion action is clear and appropriate for the buyer stage.
· Every form field has a current business reason.
· Proof addresses the risks that matter to the intended buyer.
· Mobile layout, speed, and form behavior have been tested.
· Conversion tracking records the completed action once.
· Lead quality is reviewed after the initial form submission.
· Source and device segments are checked before a page-wide change is made.
This process is more useful than copying a competitor layout. A strong landing page is specific to its traffic, offer, and sales process. The page should make the next step easier to understand without lowering qualification standards blindly.
How to test changes without chasing noise
Testing works when the question is specific. Change one meaningful element because you have a reason to believe it affects visitor behavior, then measure the result against the same conversion definition. Random redesigns make it hard to know what caused a difference.
Start with a hypothesis tied to observed evidence. If mobile visitors abandon the form at a higher rate, test the mobile form experience. If paid-search traffic converts poorly for one ad group, test stronger message match for that intent. If qualified leads fall after a form reduction, revisit which field helped screen out poor-fit submissions.
Sample size matters. Small B2B pages may not receive enough conversions for a classic A/B test to reach a stable result quickly. In that case, use longer observation windows, combine quantitative data with form-error logs and sales feedback, and avoid declaring a winner after a handful of submissions.
Keep the landing page conversion rate benchmark in the background during testing. The primary comparison should be the page’s own prior performance under similar traffic conditions. External B2B landing page benchmarks can suggest that a page deserves attention, but they can’t prove that a specific design change caused improvement.
The final check is downstream quality. A lead generation conversion rate has limited value if later-stage quality is moving in the opposite direction. A test that increases form submissions but reduces qualified-lead rate can move the wrong metric. Track enough of the sales path to see whether the experiment improved useful demand.
Conclusion
A good B2B landing page conversion rate can’t be reduced to one percentage. Current landing-page research places SaaS at a 3.8% median and commercial and professional services at 6.1%, while the broader all-industry median is 6.6%. Those figures make roughly 3% to 6% a useful reference band for SaaS and professional services pages, but only when the conversion action and traffic are comparable. B2B-only data from 2026 sits lower, at about 1.1% to 3.5% depending on industry and page type.
The better way to use a landing page conversion rate benchmark is to treat it as a diagnostic reference. Compare like with like, then measure the page against its own historical baseline. Segment by source and device, confirm that tracking is clean, and connect the initial conversion to lead quality.
A B2B conversion rate becomes useful when it answers a business question. The page should create enough qualified next steps at a cost the company can support. If the rate rises while qualified opportunities weaken, the number has improved on paper while the funnel has moved in the wrong direction.
FAQs
What is a good landing page conversion rate for B2B?
For SaaS and professional services pages, roughly 3% to 6% is a useful reference range based on Unbounce’s category medians. B2B-only studies report lower rates, at about 1.1% to 3.5% depending on industry and page type. The right comparison depends on industry, traffic source, conversion action, and sales motion. A high-commitment demo page can perform well below a low-friction webinar or content registration page.
Is a 2% landing page rate bad for B2B?
A 2% rate can be weak, normal, or healthy depending on the page. It may be reasonable for cold traffic to a high-value enterprise offer, while the same rate could signal a problem on a warm campaign with a simple registration action. Check lead quality and traffic intent before judging it.
Is a 5% B2B conversion rate good?
A 5% rate sits within the 3% to 6% reference band for SaaS and professional services pages, and it’s above the averages reported in B2B-only studies. It should still be compared with similar pages and followed by qualification metrics. The key question is whether those conversions become useful sales opportunities.
What is the average SaaS landing page conversion rate?
Unbounce reports a 3.8% median for SaaS landing pages in its current benchmark report. Individual SaaS pages can differ because demo requests, trials, and gated resources ask for different levels of commitment.
What is the landing page conversion rate benchmark for professional services?
Unbounce reports a 6.1% median for commercial and professional services landing pages. The category contains many different service types, so a firm should compare its own page with the closest available subcategory and traffic source.
How do I calculate a landing page conversion rate for B2B?
Divide the number of completed landing-page conversions by the number of landing-page sessions, then multiply by 100. If you use users instead of sessions, keep that choice fixed. Keep the denominator and conversion definition consistent across reporting periods so the rate can be compared fairly.
Should I use users or sessions to calculate conversion rate?
Either can be used if the reporting method stays consistent, but they answer slightly different questions. User-based rates describe the share of people who converted, while session-based rates describe the share of visits that converted. Don’t compare one method with the other as if they were identical.
Why does paid search convert differently from paid social?
Paid search often captures existing intent because the visitor searched for a topic before clicking. Paid social can interrupt people who weren’t actively searching at that moment. The source changes visitor intent, which can change the landing-page conversion rate even when the page is unchanged.
Should demo requests and content downloads use the same benchmark?
No. A demo request usually asks for more commitment and often triggers sales contact, while a content download is usually an earlier-stage action. Their conversion rates should be measured and compared separately.
Can a high landing page conversion rate be a problem?
Yes. A high rate can be misleading if the page attracts poor-fit leads, spam, job seekers, students, or vendors. Review qualified-lead rate and opportunity creation before treating a high form-completion rate as success.
How many form fields should a B2B landing page have?
There isn’t a universal field count. Ask only for information needed before the next step can happen. Remove fields that can be collected later or inferred safely, and keep essential qualification fields when they prevent poor routing or wasted sales time.
Does page speed affect B2B landing page conversion rate?
Slow or unstable pages can create friction before a visitor reaches the form. The size of the effect varies by site, so measure your own page with real-user data and compare conversion behavior before and after technical changes.
Should I remove navigation from a B2B landing page?
It depends on the page and visitor intent. Removing unrelated paths can keep a campaign page focused, but some B2B buyers need access to security, pricing, product, or company information before they will submit a form. Test the choice against buyer needs rather than applying a fixed rule.
How often should I review B2B landing page benchmarks?
Review external benchmarks when major new datasets are published or when your market, traffic mix, or conversion action changes. Internal page performance should be reviewed more often because your own traffic and lead quality provide the closest comparison.
What metric should I track after the landing page conversion rate?
Track the next meaningful sales stage, such as qualified meeting rate, qualified-lead rate, or opportunity rate. The exact stage depends on the sales process, but it should show whether landing-page conversions are becoming commercially useful outcomes.